Linux
Prolog
Swipl
All the applications that are used in our Department, are maintained
by my employer (Dictu, Dienst voor ICT in Uitvoering). And all the
meta-data on those applications is stored in a database.
At this moment we use 1750 applications. And since some applications
come in different versions, we have to maintain more than 2800
versions. To make things worse, some applications are interdependent.
624 Relations are defined between the versions. And to make things
even more worse, the relations can have a weight.
In a schema this looks like this:
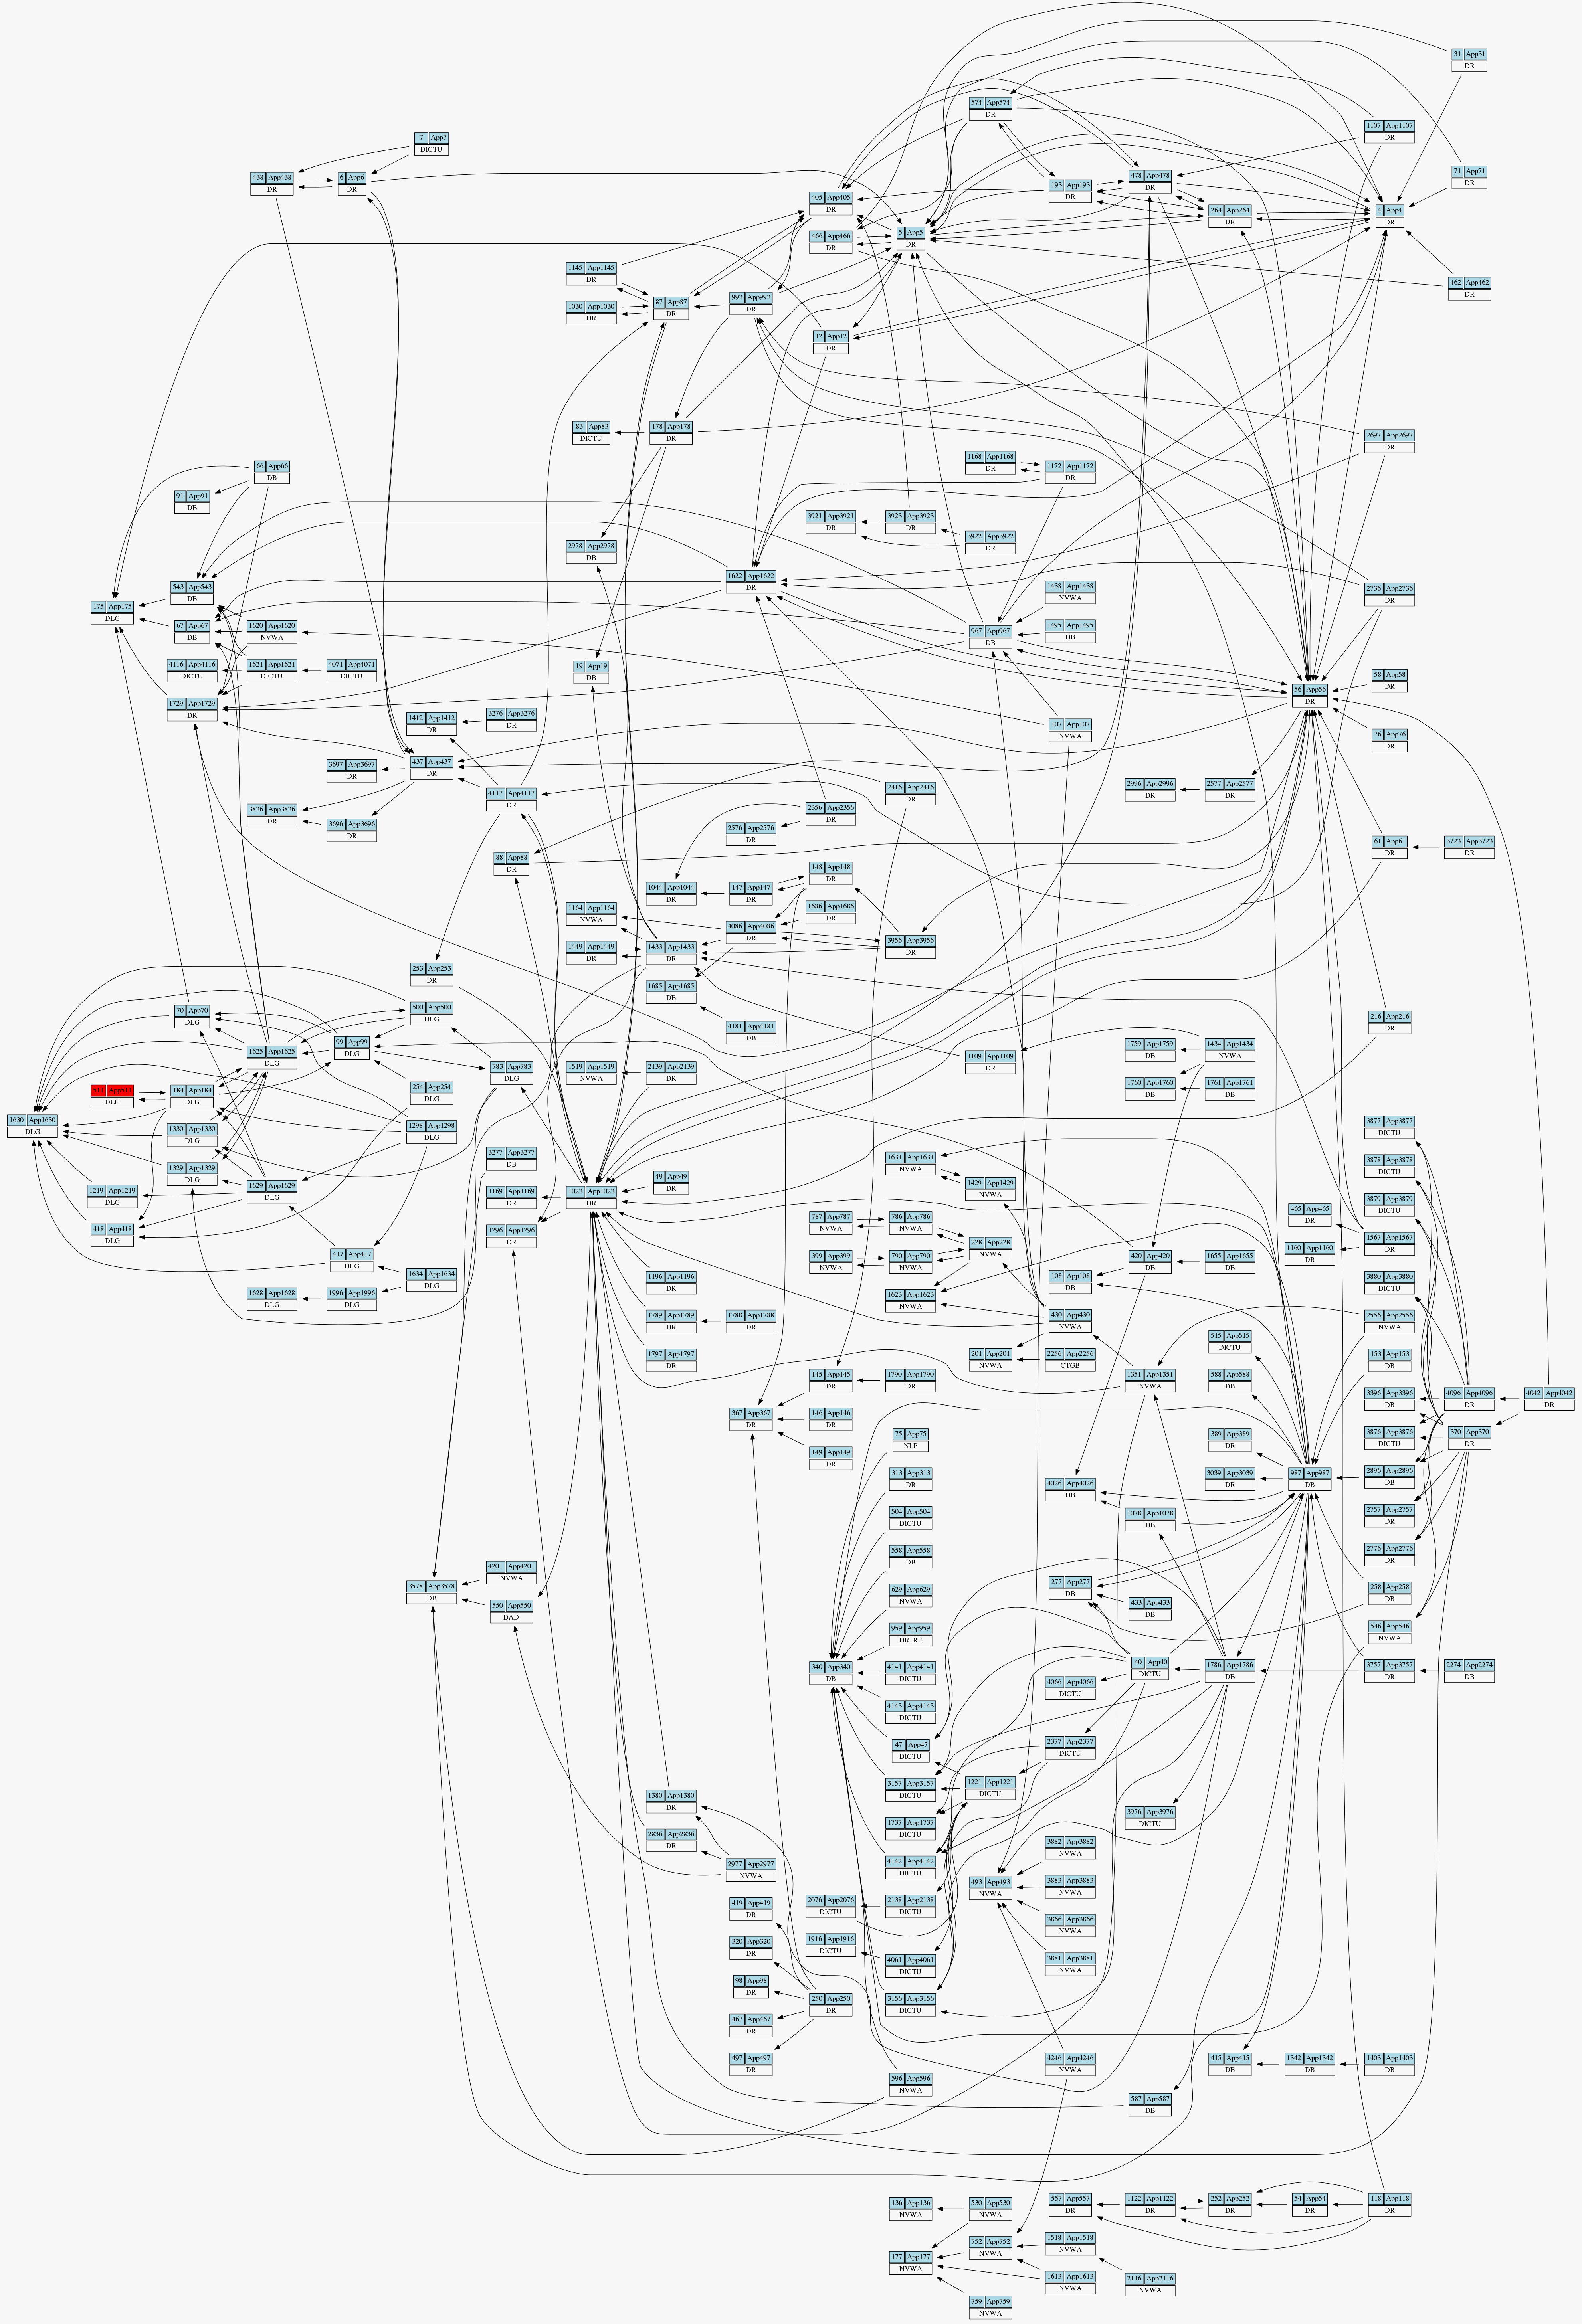
My employer
needed a graph showing all the relations between applications and
versions. The first question was if such a graph could be produced.
And since a complete graph can be enormous, the next question was 'Is
it possible to limit the graph to all the applications within a given
distance'?
Nobody knew how to query the database in such a way that only the
asked applications (and versions) were returned. And even if it was
possible to define such a query, how could one make a graph from
this?
I had once played with the Grapvizz
library. And based on what I knew of Prolog, I immediately saw these
questions as a perfect target for Prolog.
It took me half a
year to develop a program that returns the desired graphical views.
Examples are shown below.
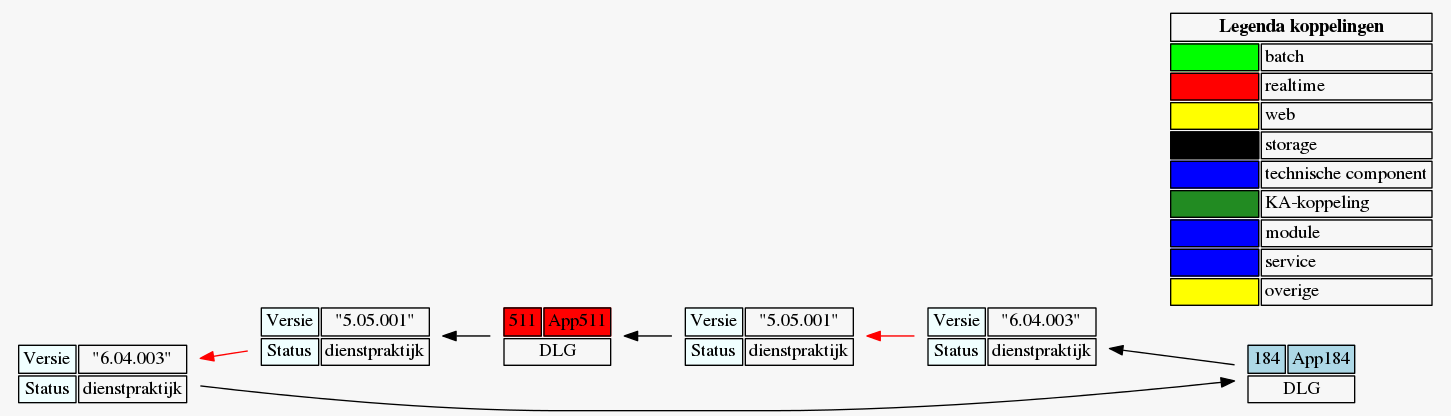
| Connections, no versions | ||
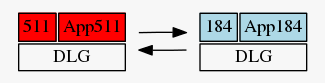 |
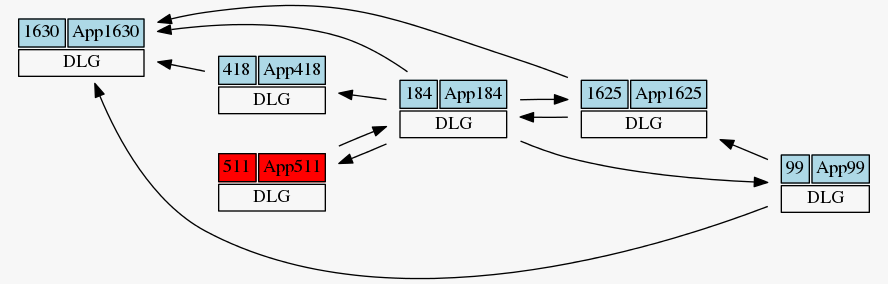 |
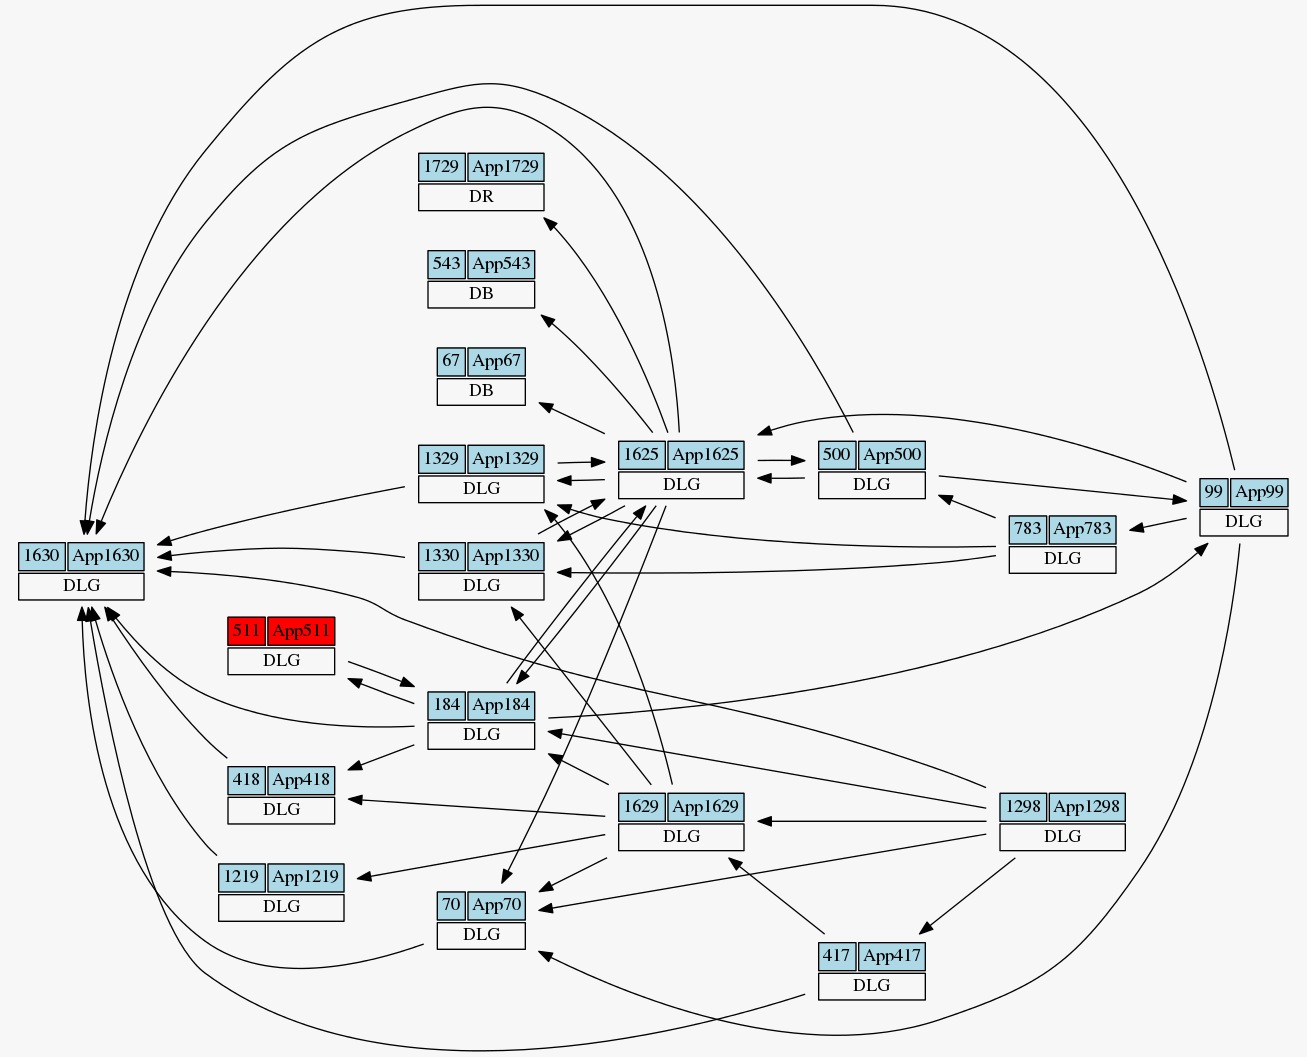 |
| Connections, versions included | ||
 |
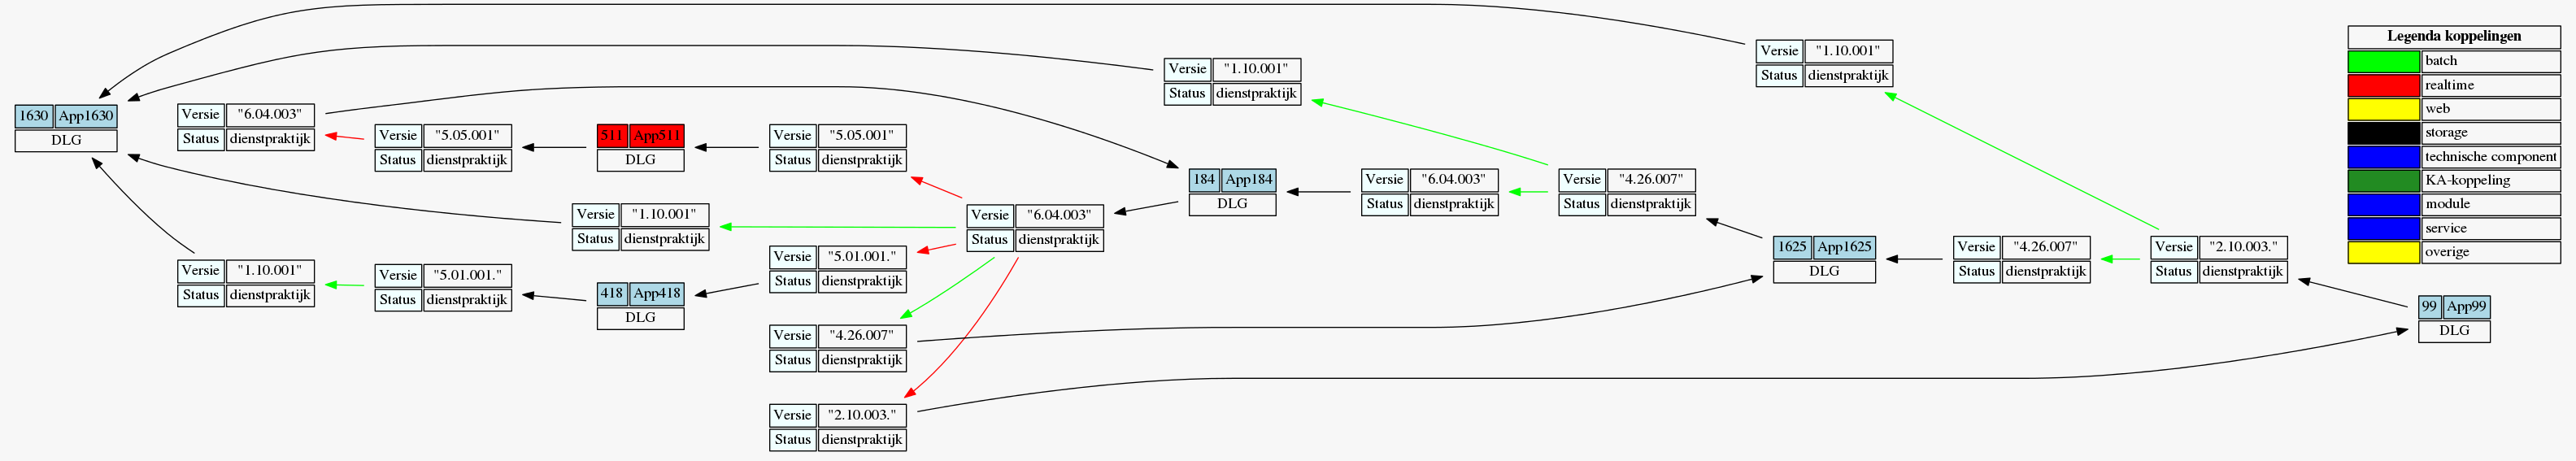 |
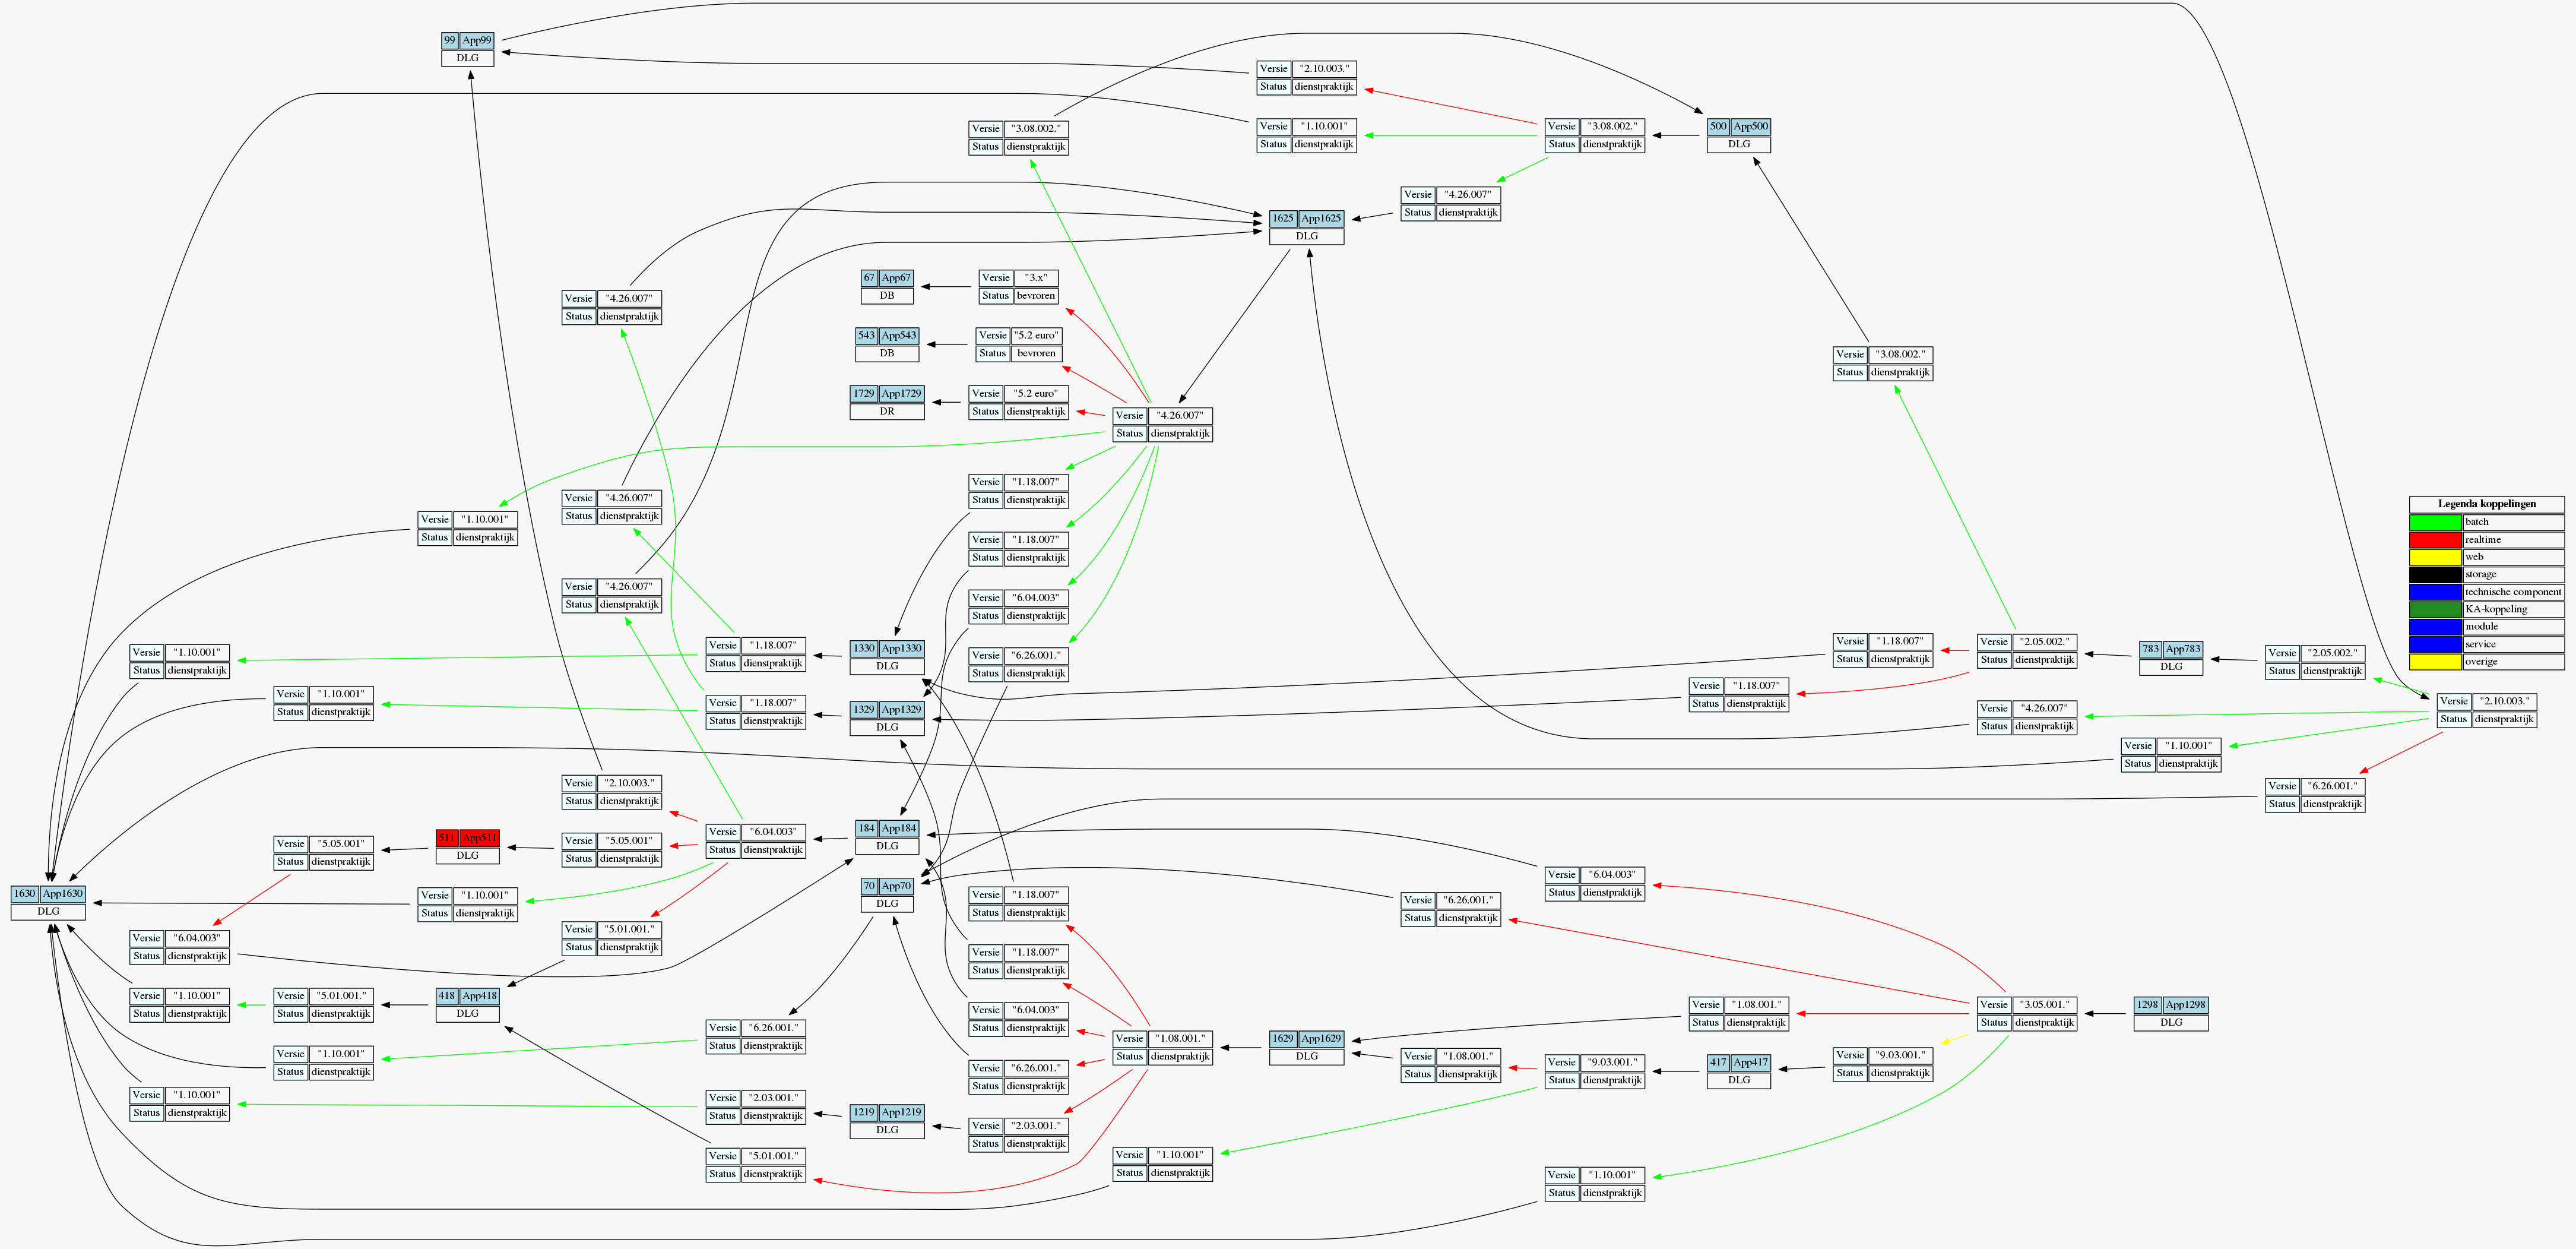 |